
In a previous post, I went over Warzone Atlanta from the perspective of an event attendee. Now that I’ve gotten my hands on the data from the event itself, I thought I would take a look at the event from a statistical perspective. I’m also trying some new techniques analyzing tournament data, with…moderate success.
Data: The data used in this analysis was kindly provided to me by the tournament organizers for Warzone Atlanta for both 2015 and 2016, but it’s little more than what should be available publicly on Best Coast Pairings when the results are posted. WZA is a decently large tournament, but there are, as usual, some sample size issues. I’m working on resolving some of those for the future by more aggressively pooling tournaments, but for now, it is what it is. I did exclude one entry from the analysis because it was missing faction information.
Army Representation:
The figure below is a bar chart of all the armies, showing the total numbers that came from each army:
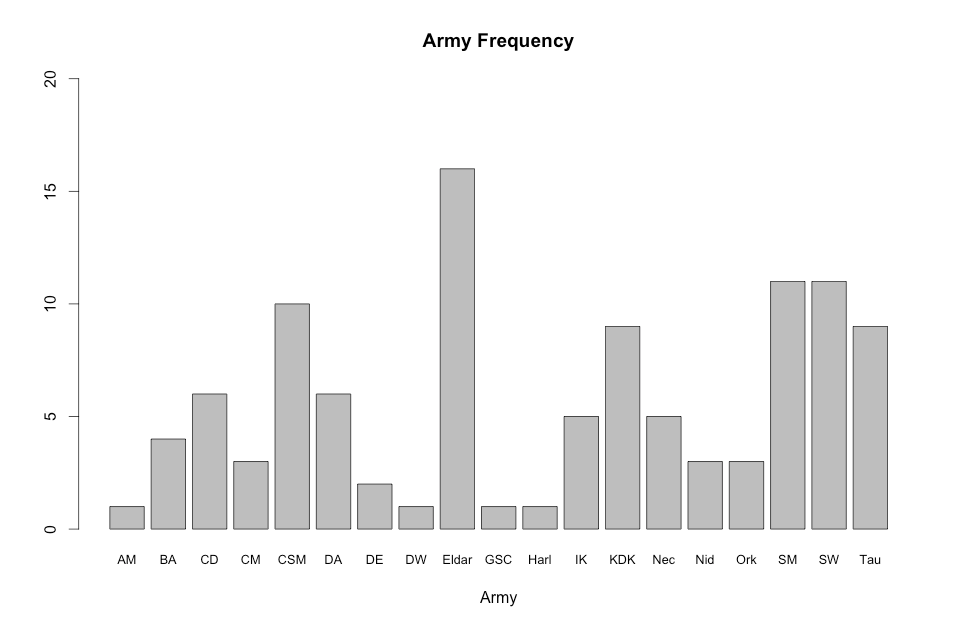
No surprise, there are a ton of Eldar armies, and a decent number of Space Marines of both the Chaos and Loyalist variety. Compared to the LVO, which I’ve analyzed in the past, Space Wolves and Khorne Daemonkin are pretty over represented, and while frequent, there are less overall Space Marine armies, and far fewer Necron armies proportionately. There are a number of possible explanations for this – the fading of Gladius as a power list, or the higher number of allowable factions meaning Space Wolves are more popular as a foundation for “A Little Bit Of Everything” Imperial armies. Relatively new armies, like Deathwatch and Genestealer Cults are rare, as are some struggling armies, like Harlequins.
Though again, the one Harlequin army there was beautiful.

Now, onto the results.
Overall Army Results: The overall median score for the event was 84 points. The mean was 85.42. For the sake of brevity, and because there’s going to be a long list later, I’m just going give the visual results of the tournament, instead of going over each faction’s media. Note armies with a single entry have been excluded here.
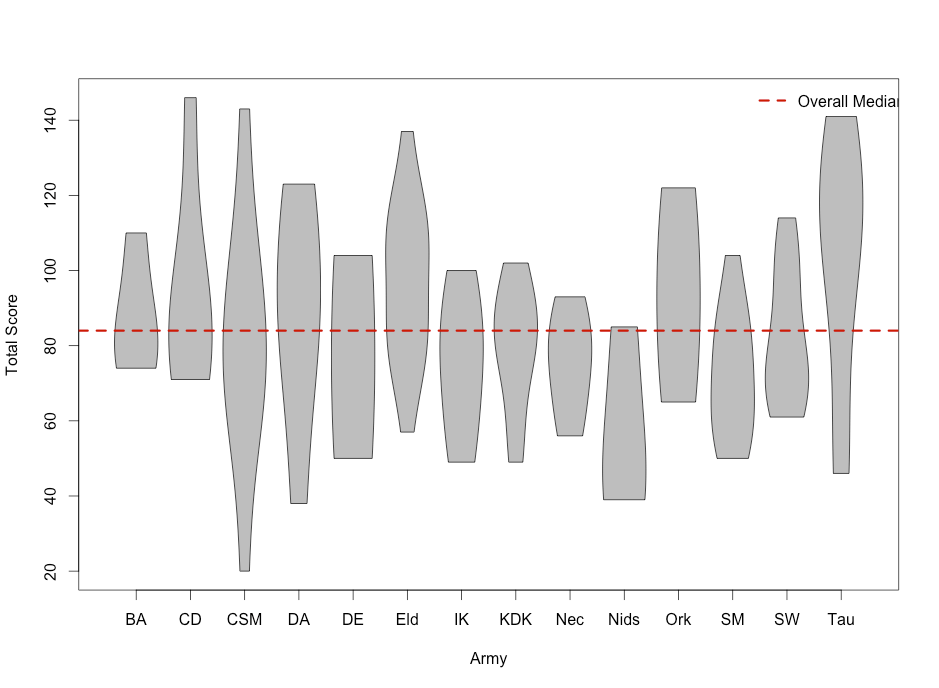
This is, to me, a very encouraging plot. There’s a much less clear tiering structure here than there are in most other tournaments – there’s some obvious standouts driven by high placing wins, but far less runaway factions. For example, Chaos Space Marines are literally all over the map, and only the Tyranids are strongly below-average performers. A few other highlights:
- Of the Space Marine factions, Dark Angels appear to be the top performers at Warzone Atlanta.
- The Necrons did surprisingly poorly. In the last couple tournament analysis posts I’ve done, they show up as a top tier army. Not so here.
- The Eldar, while still quite strong, aren’t the clear dominant faction at WZA.
- The Tau…did really well. In most tournaments, I characterize the Tau as a reliable way to get a middling-good finish, but not a great way to end up at the top tables. At WZA, that distribution is way skewed upward. I’m going to attribute this almost entirely to the Ta’unar Supremacy Suit being allowed in this event. Whether this is desirable or not is open to debate, but this is a clear illustration of how one’s tournament rules and army comp can profoundly influence the game. These are not little decisions. I also wouldn’t necessarily bank on Forge World fixing this unit soon (given the fairly slow pace of releases). But this also means you should take musings on armies with a grain of salt until you understand the local meta a commentator is coming from.
Multipliers:
In my “What’s Wrong With the Tau?” article awhile back, I provided something I called a score multiplier for several armies. Basically, this is how many points above average one can expect to do playing Army X vs. all other armies. For example, if an army’s multiplier is 1.50, they are expected to get 1.5X the battle points of an average army – in the case of WZA, that would be ~ 128 BP. What follows is a table of all the armies at WZA with more than one entry, along with a measure of uncertainty (a 95% confidence interval for those who have taken stats). Basically, an army with a number greater than 1 performs better than average, and an army with a number less than one performs worse than average.
- Blood Angels: 1.03 (0.76, 1.38)
- Chaos Daemons: 1.11 (0.88, 1.42)
- Chaos Space Marines: 0.91 (0.74, 1.11)
- Dark Angels: 1.04 (0.81, 1.32)
- Dark Eldar: 0.90 (0.59, 1.37)
- Eldar: 1.15 (0.99, 1.35) – this goes to 1.19 (1.02, 1.39) if you exclude the author of this post, also known as the Worst Eldar Player.
- Imperial Knights: 0.88 (0.67, 1.14)
- Khorne Daemonkin: 0.93 (0.76, 1.14)
- Necrons: 0.88 (0.67, 1.15)
- Tyranids: 0.66 (0.47, 0.93)
- Orks: 1.10 (0.78, 1.54)
- Space Marines: 0.83 (0.69, 0.996)
- Space Wolves: 0.96 (0.80, 1.15)
- Tau: 1.22 (1.10, 1.36)
Some notes on this – in the WZA meta, the Eldar and Tau are the top performers overall, with Chaos Daemons trailing behind them, and most other armies clustered around 1. This is, again, not a bad thing. A perfectly balanced game has everyone around 1. This does mean I may give the guys on Forge the Narrative a break for complaining about Tau ruining the game – in their area, they are. Though in fairness, it’s also the logical consequence of their very free ranging composition rules.
Predicting Performance:
To extend the analysis of WZA a little past what I’ve done for other tournaments, I tried out the idea of using these multipliers to predict the performance of each individual player. I was hoping to use ITC points as a means of prediction as well, but a large number of players only had WZA as their ITC result. Instead, I settled for their previous placing at the 2015 WZA, with players who didn’t attend last year assigned the mean placing (there are other ways to handle missing data like this, but I think this is a reasonable first pass).
The score multiplier for previous placing is 0.992 (0.989, 0.996). So basically, for each one unit increase in your placing in 2015 (First to Second, or 27th to 28th) your predicted BP score in 2016 is reduced by a little under 1%.
So then…how does something like this do?
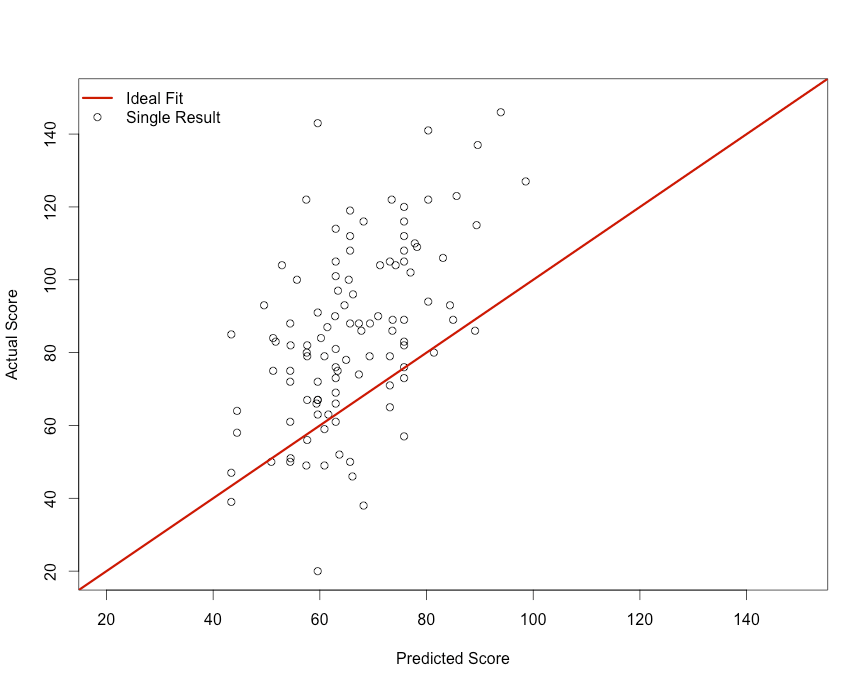
The red line would be perfect performance – the predicted score perfectly matching the actual score for each player. Clearly, this model isn’t perfect. There are a number of reasons for that, each of which could stand some refinement:
- There are just bad players. For example, myself. My result was 57 BP, and my predicted result was 75. The model cannot yet distinguish things like “This guy brought a friendly list to a major tournament”. This really can’t be fixed, though in heavier ITC-focused environments, using ITC points might help.
- Similarly, it’s difficult to detect good players. Of the Top 10 players, 3 hadn’t attended WZA 2015, which dragged their predicted scores down. This is, if nothing else, the inevitable consequence of the growth of the event. As event sizes stabilize, this may improve.
Basically, a model built largely on just “what army do you play” actually turns out to underestimate the performance of players – clearly more work is needed in trying to quantify player ability as well as army performance. Right now, the model just can’t capture top players – it underestimates about 30% of the field. But it’s a promising first step.
Closing Thoughts: Despite the massive changes we’ve seen in the game recently in terms of the ruthless release schedule, there’s not a huge amount of disruption yet. There are, for example, not enough Genestealer Cult armies operating yet to understand if they have a major effect. But what we can see comparing this to other tournaments is that it acts as a very vivid illustration of how impactful army composition rules are. There’s not enough data here, yet, to see about other effects, like the WZA mission set. Perhaps someday.
In the meantime, my plan is to start more extensively pooling tournaments to get large sample sets, and thus, hopefully, start improving predictive models of tournaments. Stay tuned.
Enjoy what you read? Enjoyed that it was ad free? Both of those things are courtesy of our generous Patreon supporters. If you’d like more quantitatively driven thoughts on 40K and miniatures wargaming, and a hand in deciding what we cover, please consider joining them.
Permalink
Sir, thank you so much! But where is IG / Astra Militarium? Non a single person played them?
Permalink
There was a lone IG player, but I dropped any single-army analysis because it does very weird things to the results.
Permalink
Enjoyed the read very interesting. I love that there is a provable trend that the game isn’t as broken as people think, ultimately we encounter dice and better players. Amazing time at Warzone ATL and good to have met ya..Ben McKenzie (AL guy from lobby on day 1).
Permalink
In my case, I encountered a *lot* of better players.
Hanging out in the lobby with you guys was a blast 🙂
Permalink
As the last place finisher there(20 pts woo!), down skewing the CSM results its interesting to see my effects on the results. Also, one thing to keep in mind with WZA is that they allowed 30k lists as well, so my 30k Alpha legion were counted in faction CSM. This sort of complicates the data, as I know at least 3 other 30k players that were at the bottom with me bringing down SM and CSM averages (but having a damn good time doing it!).
Permalink
Yeah – sadly I couldn’t identify the 30K armies to parse them out. You may have lost, but you looked good doing it 🙂
Permalink
My Tau list did great at ATC, horrible at NOVA, and a little above average at Warzone. For me it has a lot to do with psyker armies. Almost everything I played at NOVA was psyker heavy but at ATC and Warzone I did not hit a lot of psyker. Super Tuna definitely affected the Tau results. Most top tables had them consistently. Had a blast though and it always neat to see how you parse out the results.
Permalink
hey that’s my hand in the picture above showing off that Harlequin goodness.
Great article and thank you again for a great game.
See you next year
Permalink
Thank you! That game was a blast.
Permalink
I’m proud to represent the peak of the Tyranid range. Makes me feel a bit better about a performance I wasn’t totally happy with, largely down to pairings. Thanks as always for a solid article.
Permalink
Great report. Are you able to did deeper? For instance with the deamon armies are you able to tell if the ones that do well are ‘screamer star’ or deamonette spam? Can you tell if ‘footdar’ does better than ‘mechdar’? Do CAD forces do better than detachments? Do you have to have a death star to be competitive?
Again really interested in what you are doing here. Thank you.
Permalink
Can’t speak for the author, but doubt it. Generally he’s only getting results by listed faction. A bit harder to get a hold of lists from all participants and then qualitatively group them.
Permalink
FTGTEvan is correct – I’m mostly working off Primary Faction, so it’s even more coarse than that, and probably contributing to some of the problems due to the heavy use of allies.
Beyond just “I don’t have the data to do that” there’s also only so much data at all. For example, there were, by the looks of it, about 7 Chaos Daemon armies. Splitting those up between Screamer Star, Summoning Heavy, etc. etc. is a statistical non-starter. Probably the only two groups where that would be viable are “Eldar” and “Assorted T4 3+ Imperials”
Permalink
If I understand correctly you are saying that even if you had the full army lists, parseing the factions more finely would shrink your sample size into insignifiance.
Accepting that you still lack data, if you had the full army list, could you rank the field by most expensive unit, to see how important deathstars were? Or make a cut off? Units over 400 points are deathstars for example. Armys with deathstars performed….
Permalink